This is my final project!
Please click this to view larger: One Piece Map
Have a great summer!!!
Monday, May 11, 2015
Sunday, May 3, 2015
Lab 10 - Creating a Heat Map
This map shows the heat map of population of 20 random cities in Illinois.
Heat Map
Final Weekly Post!
The map I found is really fascinating! You can change places to see a luminous city and use zoom in-and-out.
I wish I could make like this. I think this might be possibly made by using Javascript.
Luminous Cities
I wish I could make like this. I think this might be possibly made by using Javascript.
Luminous Cities
Weekly Post #9 - Earthquake in Nepal
Unfortunately, the earthquake hit Nepal on April 25 and nearly killed more than 7,000 people.
This map below shows the points where magnitudes occurred.
Earthquake in Nepal
This map below shows the points where magnitudes occurred.
Earthquake in Nepal
Weekly Post #8 - Interactive Javascript Map
There are too many Interactive JavaScript map sites you can find, but this map I found is interesting.
Midnight Commander
Wednesday, April 22, 2015
Monday, April 20, 2015
Lab 7 - Population, by County
Finally, I am done with lab 7!!!!!!!!!!!!!!!!!!!!!!!!!!!!! :D
2012 Percentage of Population, by County
2012 Percentage of Population, by County
Sunday, April 19, 2015
Weekly Map #7 Zoom In and Out
Check this out:
Zoomable World Map
Once you downlad this map, you can edit it such as text or colours.. Also, you can zoom in and out.
Zoomable World Map
Once you downlad this map, you can edit it such as text or colours.. Also, you can zoom in and out.
Wednesday, April 8, 2015
Proposal Project Change!
I am a huge fan of manga (Japanese comic books) titled "One Piece". The treasure, "One Piece," is left somewhere in the world by the famous Pirate King Gol D. Roger. Before Roger's execution, he announced his treasure will be available to anyone who finds it. This starts causing the Great Pirate Era.
A young man named Luffy, is inspired by powerful pirate Red Haired Shanks, sails off on a journey to find One Piece. His dream is to become King of the Pirates. In order to reach One Piece, he wants to organize his own crew and needs a powerful ship that can survive on a journey. Through his journey, he encounters numerous races and villains.
Here is the world of One Piece maps:

 How amazing these maps are?! Yes, these maps look strange! I will not explain details here! :)
For the final project, I will map out a One Piece map. I will make a map on my own like the map above. An interactive map will be added. it will display a ship moving to each island where Luffy goes on his journey, where he finds his crew, and encounters numerous villains. When a ship arrives an island, the pictures and small plots will pop out.
A young man named Luffy, is inspired by powerful pirate Red Haired Shanks, sails off on a journey to find One Piece. His dream is to become King of the Pirates. In order to reach One Piece, he wants to organize his own crew and needs a powerful ship that can survive on a journey. Through his journey, he encounters numerous races and villains.
Here is the world of One Piece maps:
For the final project, I will map out a One Piece map. I will make a map on my own like the map above. An interactive map will be added. it will display a ship moving to each island where Luffy goes on his journey, where he finds his crew, and encounters numerous villains. When a ship arrives an island, the pictures and small plots will pop out.
Sunday, April 5, 2015
Final Project Proposal
For
my final project, I plan on mapping out a Russian population. The audience for
this project will be the demographers and others who are very fascinated with
populations.
What
I want to show: show: an interactive timeline of population and issues (depopulation,
WWII) that impacts population.
Thanks
to TimeMaps website for inspiring me for my project. This website displays the
entire world including the icons that can be tapped to zoom in for historical
summary.
I
will be using the Flash because I don’t know much about D3 (it drove me crazy!)
so Flash will be a good idea to use. The map you will see is the main page that
displays Russia. Two small squares will be put below this map. Both squares
will converted to a button. One left square
will be clicked to display Russia with subdivisions including issue summaries
and pictures. Another right square will be clicked to display charts of
population.
Here
are the steps below what I will work on.
1)
Add
Russia shapefile from ArcMap
2)
Make
a main page and add a Russia map picture
3)
Use
rectangle tool to create two squares, then convert these to buttons.
4)
Add
population data to each subdivision.
5)
Convert
subdivisions to the buttons.
6)
Add
Zoom In and Out for each subdivision.
7)
Add
a summary of issues to each button on subdivision.
8)
Hover
over subdivisions to make pictures displayed.
9)
Add
population history charts
10)
Add
a Back button to the “main page”
11)
Add
a splash screen.
For
these steps I will work for now. I might add something new if I have an idea.
As
for the obstacles I foresee are adding Russia shapefile to Flash, a splash
screen and buttons. I will figure out how to add Russia shapefile to the Flash.
It involves ArcMap importing shapefule
to the Flash. I would like to add a splash screen, but I don’t sure how yet. I
just want it to be creative. I am working on understanding how buttons work and
how to use Back button to the “main page”.
Russia
has many subdivisions so I hope to be able to find more population data and
history for all subdivisions. Further Eastern Russian seems to have less
population data and history due to the lesser cities so I will do my best
finding data. My goal to accomplish what I have done so far and to make the map
presentable.
Wednesday, April 1, 2015

Wednesday, March 25, 2015
Monday, March 23, 2015
Weekly Map #6
INTRODUCTION TO THE HOLOCAUST
It has a good splash screen including the introduction before showing the map of the Holocaust.
It has a good splash screen including the introduction before showing the map of the Holocaust.
Monday, March 16, 2015
Sunday, March 15, 2015
Weekly Map #5
Look at what I found reallllllllllllly amazing!!!!
World Atlas Timeline
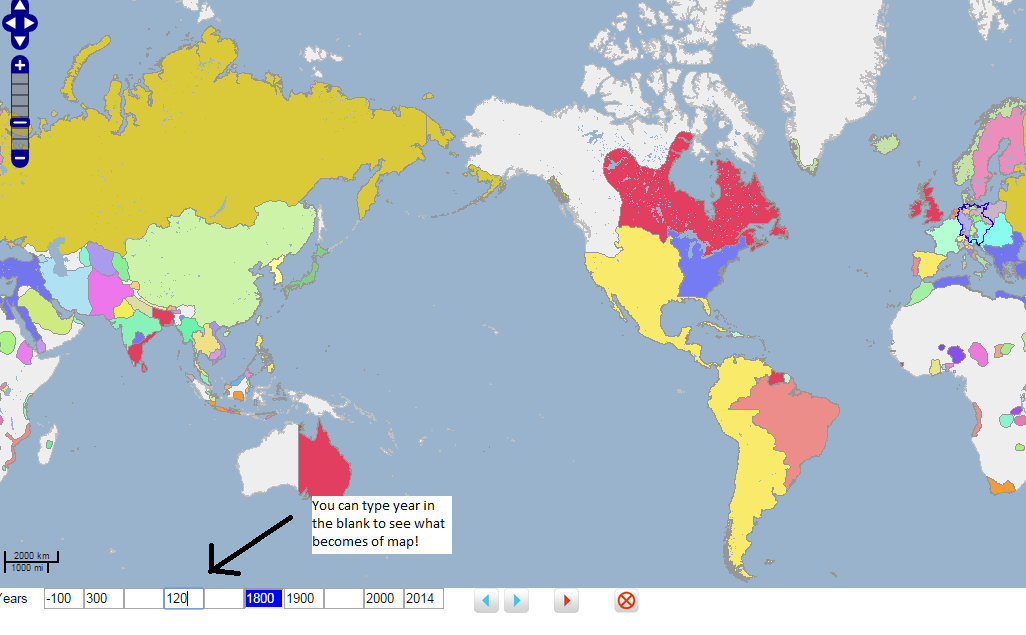 Zoom in to see my comment!! When you are done with typing year (any year you will like to look at) in all the blanks, you can click Play to see changes in the map! It's so fascinating that you can put random year and then play it to see it! :)
World Atlas Timeline
Weekly Map #4
I hope all of you is enjoying your spring break!!!
Here is it I found:
Territorial Expansion of the United States
It's really hard to find good tween interactive maps. Though, this map is not bad. This map shows the territorial expansion of the United States between 1783 and 1853.
Territorial Expansion of the United States
It's really hard to find good tween interactive maps. Though, this map is not bad. This map shows the territorial expansion of the United States between 1783 and 1853.
Sunday, March 1, 2015
Weekly Map #3
Small Area Icome and Poverty Interactive Map
This link takes you to the United States Census site. There are a lot of various estimates you can check out. The map I selected is above. When you open this, you can see the map and the map legend on left side. You can change it under the map legend to see results on the map. The colors will change.
Monday, February 23, 2015
Sunday, February 15, 2015
Weekly Map #2
 |
| Source: http://www.timemaps.com/history |
As you are looking at the map, you can see icons over countries and you can cursor over icons to view. If you want to look at Europe, you can click it and zoom in. Below is what it will look like:

Moreover, there are buttons that show years, you can see change over time by clicking.
Sunday, February 8, 2015
Lab 1 - Earthquake hits Banda Aceh, Indonesia
Below are two images of Banda Aceh, Indonesia. Unfortunately, the massive earthquake struck the Indian Ocean off the coast of Sumatra, Indonesia on December 26, 2004. Two images you are looking at, shows before and after effects of a tsaumai.
Before

After

These images are the satellite views that were taken two days after the incident. "After" image discloses a flooded, devastating landscape. Roads and brides were destroyed. Houses were collapsed. These images accentuate how much has changed before and after the effects of a tsunami.
My first blog and Weekly Map #1!!

Subscribe to:
Comments (Atom)